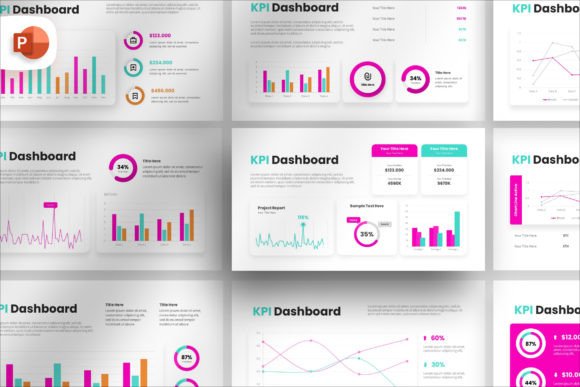
Playful KPI Dashboard PowerPoint: A Fresh Take on Data
Let's be honest, most presentations about key performance indicators feel dry and disconnected. We stare at flat bar charts and endless bullet points, and our attention drifts. The Playful KPI Dashboard PowerPoint template is a direct response to that fatigue. It’s not just a collection of slides; it’s a design asset built to transform complex data into a visual story that people actually want to follow. The core idea is simple: information that is engaging is information that sticks.
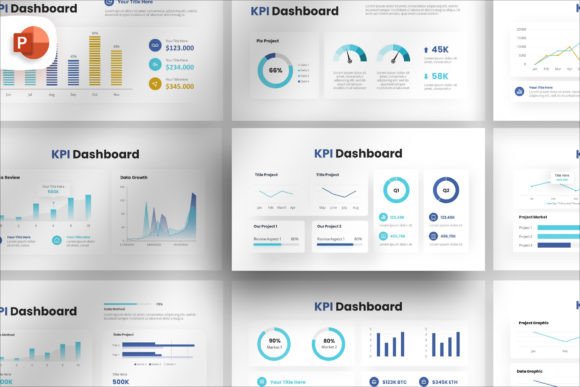
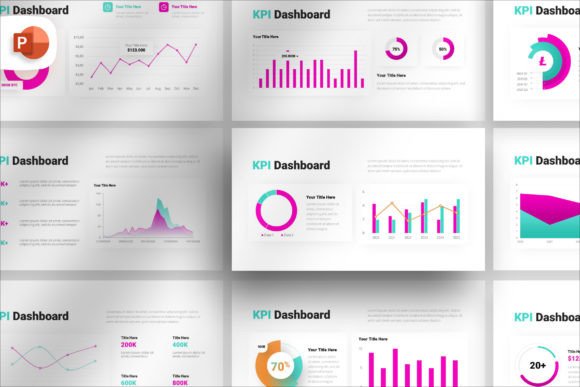
Visually, this template avoids the sterile, corporate blue palette you see everywhere. Instead, it embraces a softer, more approachable aesthetic. You'll find rounded shapes, friendly icons, and a color scheme that feels modern and optimistic. The personality is energetic yet professional—it’s designed to make a point without shouting. The overall appeal lies in its ability to present numbers, processes, and strategies in a way that feels collaborative and clear, rather than like a lecture. It uses visual hierarchy masterfully, guiding the viewer's eye exactly where it needs to go, which is the true mark of effective modern typography and layout principles applied to presentation design.
Where This Visual Style Truly Shines
The versatility of the Playful KPI Dashboard PowerPoint makes it a valuable tool for a wide range of projects. For brand identity and marketing, it’s perfect for internal team meetings, client reports, or campaign retrospectives. The playful elements help soften the delivery of tough metrics, making conversations more productive. Entrepreneurs and small business owners can use it to pitch to investors or present quarterly results to stakeholders, where clarity and engagement are directly tied to confidence.
Beyond business, it’s a fantastic resource for educators and content creators. Imagine breaking down a complex tutorial or the results of a community survey using its drag-and-drop mockup devices and auto-adjusting placeholders. Bloggers can create stunning media kits or partnership proposals, while crafters and hobbyists might use it to plan and present a community project or workshop series. Its strength is in taking any structured information—whether it’s a sales funnel, a project timeline, or a learning pathway—and giving it a coherent, visually appealing framework.
Practical Guidance for Seamless Integration
When you download the package, you get more than just 21 slides. You receive a design asset that’s meant to be integrated into your workflow. The first step is to evaluate the included documentation. It’s not just a PDF; it’s a guide to the template’s logic, helping you understand the intended visual hierarchy and how to maintain it as you customize. This is crucial for maintaining professionalism and consistency across your deck.
One of the most practical features is the drag and drop picture placeholder. This isn’t just about convenience; it’s about efficiency and ensuring your images are perfectly framed and styled every time. The auto-adjustment for size, transparency, and shape means you spend less time fiddling with formatting and more time refining your message. The included premium font files, with a free license, are a thoughtful touch. They ensure your typography matches the template’s personality right out of the box, which is vital for brand perception.
However, a template is a starting point, not a final product. Here’s how to make it your own:
- Color Palette: While the default colors are engaging, don’t hesitate to swap them for your own brand colors. This simple change instantly personalizes the presentation and reinforces your brand identity.
- Font Pairing: The template uses its own display font for headings, which has a friendly, slightly rounded character. For body text, consider pairing it with a clean, highly readable sans serif font like Open Sans or Lato. This creates a clear visual hierarchy that guides the reader from headlines to details.
- Content Refinement: The slides provide structure, but your content is the star. Use the provided shapes to frame your key metrics. Instead of listing ten bullet points, distill your message into three core takeaways and let the visual layout do the heavy lifting. This approach enhances readability and audience engagement.
Remember, the goal of a Playful KPI Dashboard is clarity with character. It’s a tool designed to help you communicate complex ideas with confidence and a touch of creativity. By thoughtfully customizing its elements, you move beyond using a generic creative font or layout and start building presentations that are truly your own—professional, impactful, and memorable. It’s a practical example of how strong design assets can elevate everyday communication, whether for a boardroom, a classroom, or a community forum.